Note 01 · Capacity
Your average answer time is hiding the loss, not showing it
A phone report that says "average speed of answer: 22 seconds" is describing a month.
Nobody calls you in a month. They call you at 8:14 on a Monday in January, and what
matters is how many agents were on the phones during that half hour and how many
other people were calling at the same time.
Queueing behaviour is violently non-linear. An interval running at 60% occupancy
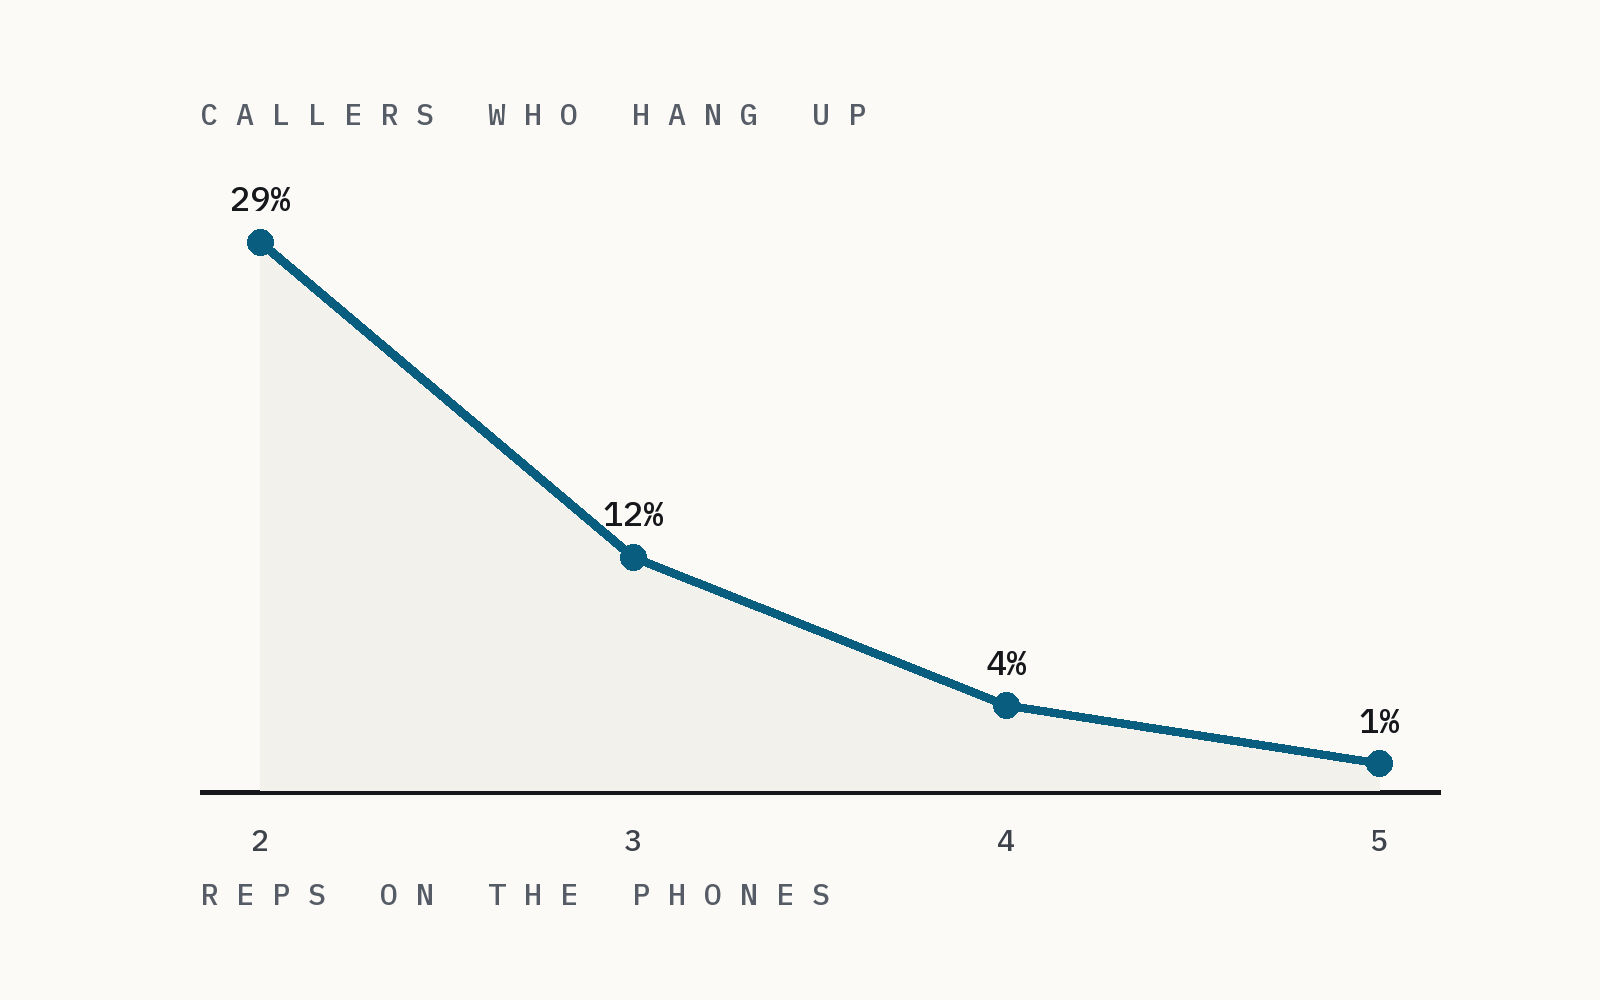
answers almost everyone quickly. The same team at 90% occupancy has callers waiting
several minutes, and a meaningful share of them hang up. Because most intervals in a
month sit in the comfortable range, they drag the average down and conceal the
handful of intervals doing all the damage.
This is why the analysis works at thirty-minute resolution and reports an occupancy
map by day of week and half hour rather than a monthly figure. Loss does not occur on
average. It occurs in intervals, and those intervals are usually the same ones every
week, which is also what makes them fixable.
Note 02 · Conversion
Your best-converting rep may not be your best rep
Pull booking rate by CSR out of any field-service system and you will get a ranked
list. The name at the top is not necessarily your strongest closer. It may just be
whoever gets handed the emergency calls.
A customer with no heat in February is a different prospect from someone pricing a
maintenance plan in September. Emergency calls book at a much higher rate for reasons
that have nothing to do with how the call was handled. So does a repeat customer, and
so does a referral. If one rep's mix is skewed toward those, their raw booking rate
is flattered, and every conclusion drawn from the ranking is wrong, including which
rep the rest of the team should be trained to imitate.
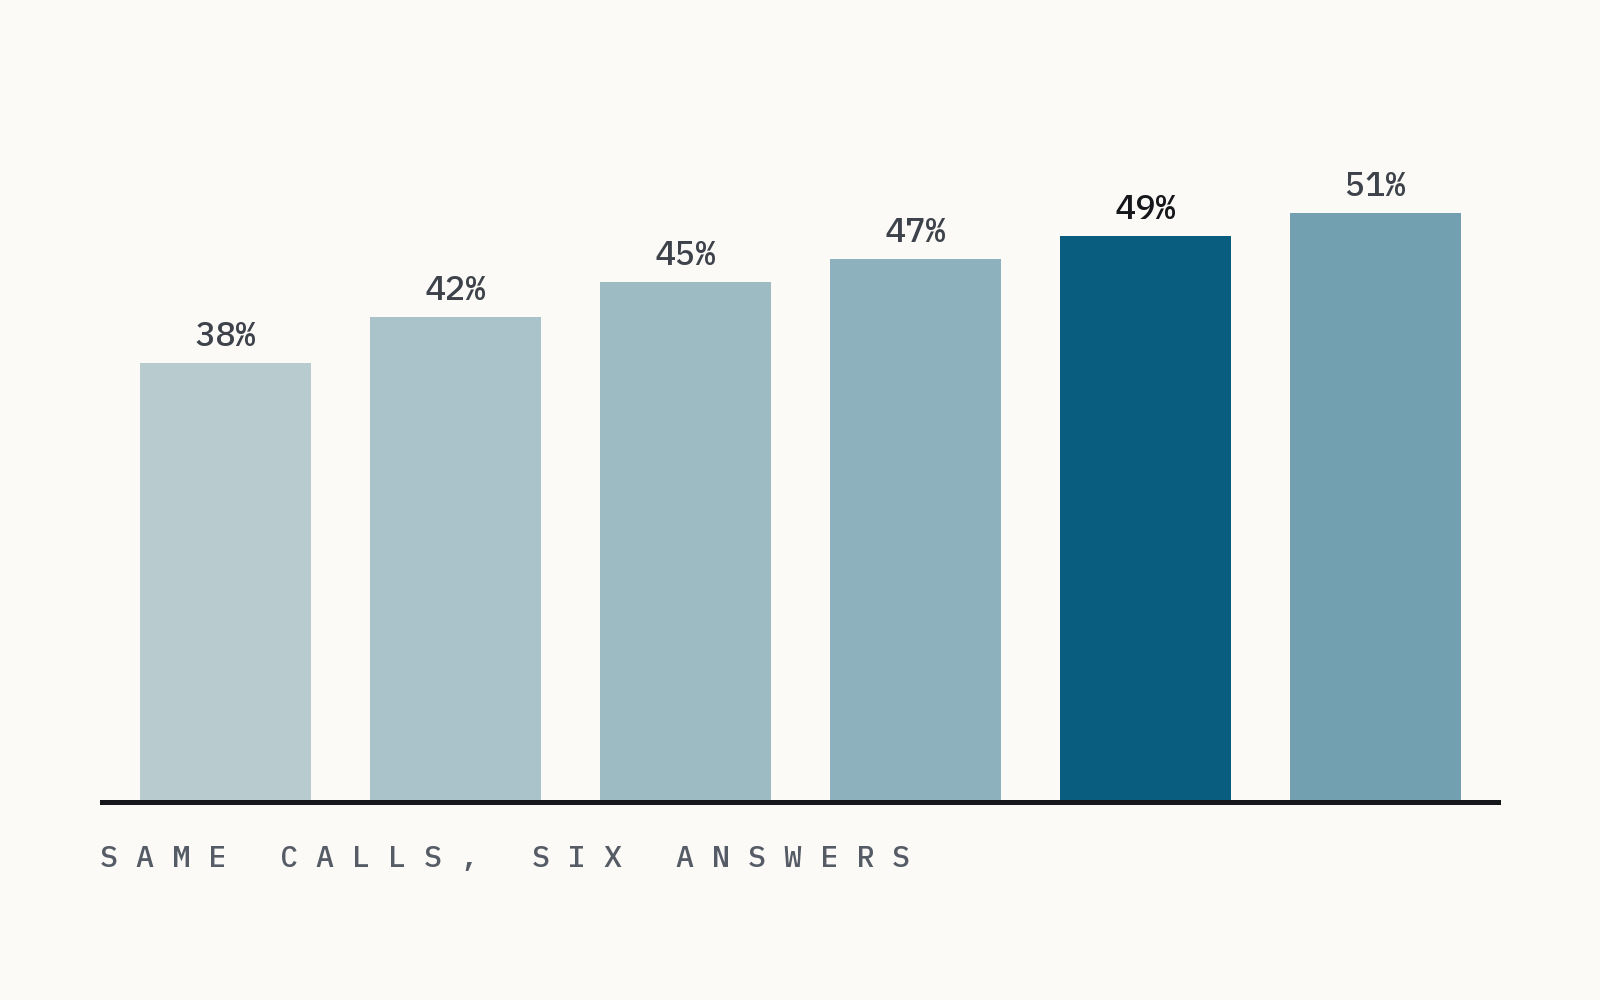
In a simulated operation we use for testing, we deliberately seeded exactly this: a
rep of ordinary skill working a dedicated emergency desk, whose raw booking rate came
out highest on the team. Normalizing rates within lead-source and job-type cells and
reweighting to the team's own mix moves the true best performer back to the top. The
gap between those two answers is the size of the mistake this control prevents.
The practical version: before you benchmark reps against each other, check whether
they are fielding the same kind of call. Usually they are not.
Note 03 · Turnover
The invoice is the small part
Ask an owner what it costs to lose a CSR and you will hear a number built from the job
posting, the hours spent interviewing, and the two weeks of training. It is a real
number and it is usually somewhere in the high four figures. It is also the small part.
The part nobody counts is the ramp. A new CSR does not book like a tenured one on day
one. Across a twelve-week ramp, booking rate typically climbs through something like
half, then two-thirds, then most of steady state. Every one of those percentage points
is calls that came in, got answered, and did not become jobs. That happens at full
call volume, because the phone does not know the person answering it is new.
Run the arithmetic on a busy operation and the ramp shortfall lands at several times
the visible cost of the hire. That changes what retention is worth. It also changes
how you think about a vacancy: the fourteen days before the replacement starts are not
free, because those are the intervals where the schedule has a hole in it and the
abandonment rate goes up.
Both figures are computable from records you already keep. Neither appears on any
report your software currently produces.
Want the arithmetic applied to your own operation? The
estimator
gives a rough range in about a minute, or
request a data review
and we will tell you whether your records can support a defensible figure.