Definitions
Your booking rate depends entirely on what you count
The six denominators in full, which one to standardise on, and how to stop the number moving for reasons that have nothing to do with the phones.
You are probably here because you want a number to compare your team against. The honest answer is that most published booking-rate benchmarks are not comparable to your operation, and the reason is not sample size. It is that nobody agrees on what goes in the denominator.
Take one operation, one month. A thousand inbound calls reach the phone system. A hundred and twenty abandon before anyone picks up. Of the 880 answered, 180 were never an opportunity: wrong numbers, existing customers checking an arrival window, suppliers, someone's spouse. Three hundred calls became a booked job.
Every one of the following is a booking rate for that month, and every one of them gets used in the field:
| Bookings ÷ all inbound calls | 30.0% |
| Bookings ÷ answered calls | 34.1% |
| Bookings ÷ answered, excluding non-opportunities | 42.9% |
| Bookings ÷ answered, excluding non-opportunities and existing customers | higher again |
| Bookings ÷ unique callers rather than calls | higher again |
| Bookings ÷ calls tagged as leads by the CSR | whatever the CSR tagged |
Arithmetic on a worked example, not measured data from any client.
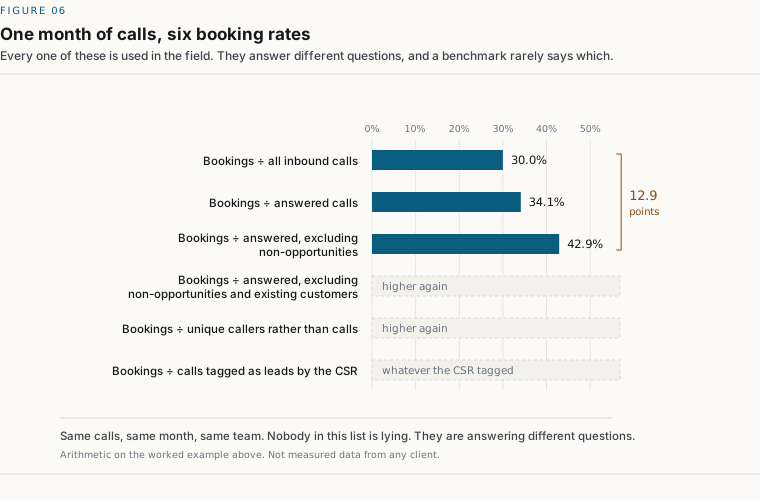
The first three alone span thirteen points. Nobody in that list is lying. They are answering different questions, and the one at the bottom (the rate computed over calls a rep chose to mark as a lead) is the one most CRMs report by default, because it is the only one the software can see without help.
So when a benchmark says the industry average is some figure, the first question is not whether the sample resembles you. It is which of these six numbers it is. That is almost never stated, and when it is not, the comparison is noise.
Even with the definition pinned down, three things move a booking rate more than skill does, and none of them appear in a benchmark:
Call mix. An emergency no-heat call in February books at a rate that has almost nothing to do with how it was handled. So does a repeat customer, and so does a referral. Two teams of identical ability, one fielding more emergency work, will post booking rates several points apart permanently.
What you sell. A team quoting $400 drain clears and a team quoting $14,000 system replacements are not doing the same job, and their rates should not match. Higher ticket means more consideration, more comparison shopping, and lower first-call conversion, which is not a performance problem.
Where the calls come from. Paid search, an aggregator, a yard sign and a neighbour's recommendation produce four different conversion populations. Shift your marketing mix and your booking rate moves without a single thing changing on the phones.
This is why a benchmark number, even a well-collected one, cannot tell you whether your team is good. It can only tell you whether your team resembles an average of operations you know nothing about.
Fair question, and we would rather answer it here than have you notice the tension yourself. We publish the DialWorth Score (a 0–100 index, ranked against other operations in your trade), and everything above still applies to it. It does not overcome call mix. It does not know what you sell or where your calls come from. It cannot tell you whether your team is good.
What it does is narrower, and we think worth having. It gives you a fast, reproducible read on three things that are genuinely comparable across operations: what share of calls you answer, what share you book, and how fast you lose CSRs. It tells you whether those three put you ahead of or behind other people in your trade who have taken it. That is a reason to look closer. It is not an answer.
Three things make it different from the benchmarks this page is about. The rubric is published in full, so you can recompute your own score by hand and argue with our weightings. The sample size is always shown, and no percentile appears at all until there are ten responses overall and five in your trade; below that we tell you how many are needed rather than dressing up a rank as a distribution. It never claims to be a measurement: it runs on figures you typed, and the diagnostic exists precisely because typed figures and measured ones disagree.
Use it the way you would use a bathroom scale: a cheap number that tells you whether to book the appointment, not a diagnosis. The section below is still the comparison that actually produces an action.
There is one benchmark immune to every problem above: your own best-performing rep.
They work your market, quote your prices, field your lead mix and follow your process. Every variable that makes cross-company comparison meaningless is held constant. If one of your people converts materially better than the rest on comparable calls, that gap is real, it is yours, and it is addressable.
The catch is "on comparable calls". A raw per-rep ranking pulled from a field-service system mostly measures who gets handed which queue. To make the comparison mean anything you have to normalize within lead-source and job-type cells: compare emergency calls to emergency calls, paid-search leads to paid-search leads. Only then look at the spread. That is more work than reading a benchmark, and it is the only version of the exercise that produces an action.
If you need something to take to a leadership meeting, build it in this order:
1. Fix the denominator and write it down. Pick one of the six definitions, state it in a sentence, and use it everywhere. Which one matters far less than whether it stays constant. Most teams should use bookings ÷ answered calls, because it is the least manipulable and the easiest to reproduce.
2. Count the calls you never answered separately. Abandoned calls are not a conversion problem and putting them in a booking rate hides them. They are a capacity problem with a different fix and a different owner. Averages conceal them, so look at them by half-hour interval.
3. Segment before you compare. At minimum by lead source and job type. If you cannot segment, your rate is a weighted average of populations you have not identified, and its movement month to month is mostly mix drift.
4. Compare internally first. Rep against rep on comparable calls, then this quarter against last. External comparison last, and treat it as orientation rather than evidence.
5. Convert the gap to money. A rate is an argument. A dollar figure with a range and a stated set of assumptions is a decision. That conversion is what the estimator does in about sixty seconds, and what a diagnostic does properly from your own call records.
The six-denominator breakdown above is free to reproduce, in a trade article, an association newsletter, a vendor help centre, a training deck, or an internal standard, provided the source is named and linked. No permission request needed. If you are restating the figures, please keep the worked example intact rather than presenting the individual rates as measured industry data, because they are arithmetic on one illustrative month, not a survey.
If you maintain a definition of booking rate in a product, a course, or an association standard and it conflicts with this one, we would rather hear about it than not: tell us where it breaks. Corrections are versioned on this page.
The six denominators in full, which one to standardise on, and how to stop the number moving for reasons that have nothing to do with the phones.
Why most QA scorecards measure politeness, what to score instead, and the calibration step nearly everyone skips.
Not every abandoned call is lost revenue. How to work out the share that never comes back, and what that share is worth.
The six-denominator problem, confirmed inside real software: how ServiceTitan, Housecall Pro and Jobber each define booking or conversion rate.
Six figures you already know gives you a screening range in about a minute. The full diagnostic prices it from your own call records in two to three weeks, for a fixed $4,500, and costs you about an hour of someone's time to pull the exports.
If your data cannot support a defensible figure, you get a readiness report naming exactly what to start capturing, at no charge, and no number is published.
Track answer rate, abandonment and three booking rates with the free call center KPI spreadsheet. It includes a worked example and checks for inconsistent counts. No signup required.