Operational diagnostics for home-service phone operations

What your phone is worth.

Your labor cost appears on the P&L every month. The revenue your phone operation forgoes does not appear anywhere. We compute it.

A phone operation's staffing design and its call-handling design each produce a measurable amount of forgone booked revenue per month. Both are computable from data you already have. Most owners have never seen either figure, because labor cost is on the income statement and forgone revenue is not.

What the measurement looks like
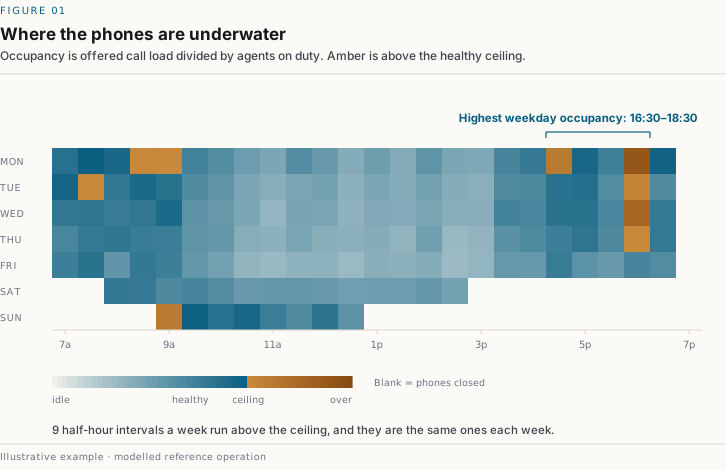
Heatmap of call-centre occupancy by day of week and half hour. Teal cells show healthy load; amber cells mark half-hour intervals running above 0.85 occupancy, concentrated in the mid-morning and late afternoon.

Figures on this site are illustrative, generated from a modelled reference operation rather than a client engagement.

What gets measured

Three components. Each computed separately, then reconciled.

They overlap, so we do not add them up and call it a total. The report shows a reconciliation from total inbound demand through to the three buckets, and it has to close.

01 / Capacity

Calls you never got to

Calls abandoned in queue, or answered too slowly, because staffing sits in the wrong place on the utilization curve. Modeled with queueing mathematics at half-hour resolution, using caller patience fitted from your own callers rather than an industry constant.

02 / Conversion

Calls you answered and did not book

Decomposed by pipeline stage and benchmarked against your own best performer — not an external ideal — with rates normalized within lead-source and job-type cells, so a rep fielding emergency calls does not look skilled for reasons unrelated to skill.

03 / Turnover

What a departure actually costs

The fully loaded cost of CSR churn, including the ramp-period booking shortfall that no owner counts. In the operations we have modeled, that shortfall typically runs several times the visible cost of recruiting and training combined.

Why you have not seen this number

Nothing in your stack is built to compute it.

I

Your phone system reports averages

A monthly average answer time hides the half-hour intervals where demand exceeded staffing. Loss does not occur on average; it occurs in intervals.

Scatter plot of abandonment rate against interval occupancy. The curve is flat at low occupancy and rises sharply past the 0.85 healthy ceiling.
II

Your field-service software reports what was booked

It has no view of the call that did not become a booking, and usually no link back to the call that did.

III

Booking rate by rep is not comparable across reps

Call mix differs. Without normalizing for lead source and job type, the rep handed the emergency queue looks like the strongest closer on the team.

IV

Turnover cost is recorded as recruiting spend

Recruiting, interviewing and training are invoiced, so they are counted. The booking shortfall across a twelve-week ramp is not invoiced, so it is not.

Engagements

Start with the measurement.

The diagnostic is fixed-fee and stands alone. Nothing after it is a condition of it.

Build

Starting at $18,000
60–90 days

Implementation of the ranked remediation, sequenced by payback.

  • Schedule rebuilt against measured demand
  • Call-handling framework and stage instrumentation
  • Callback recovery process
  • Re-measurement against the baseline
Discuss scope

Retainer

Starting at $1,500/mo
Ongoing

Monitoring and cadence once the number is moving.

  • Monthly re-measurement
  • Interval-level drift alerts
  • Percentile position against comparable operations
Discuss scope

Diagnostic pricing reflects current engagement count. It rises as the cross-client benchmark dataset grows, because the comparison it enables gets more valuable.

Who this is for

Home-service companies with a real inbound phone operation.

Profile

$2M–15M revenue

Three to ten customer service reps handling inbound calls. HVAC, plumbing, electrical, restoration, pest, and adjacent trades.

Geography

California, Oregon, Washington, Nevada

We work the Pacific time zone only. It is a deliberate constraint, not a limitation we are apologizing for.

Prerequisite

Ninety days of call data

Queue wait and abandonment logged, a CSR schedule, and completed job values. If you do not have these yet, we will tell you exactly what to turn on.

Customer service representatives wearing headsets, working an inbound call queue at a shared desk.
The measurement starts at the desk, not the truck
Where the money moves

Every booked job in your business passed through a phone call first.

Marketing spend is measured to the dollar. Technician utilization is measured to the minute. The thirty seconds between a customer dialing and a rep answering is measured by nobody — and it sits upstream of every job you will ever run.

Constraints we hold

What we will not do.

01

Give you a single number

Every headline figure ships as a range with a most-likely value. A point estimate implies a precision the underlying data does not support.

02

Claim causation

We measure association and model counterfactuals under stated assumptions. The report says "modeled" and "under these assumptions" because that is what it is.

03

Produce a number your data cannot support

Seven data quality gates run before anything is computed. If your data fails them you get a readiness report telling you what to start capturing — not a figure dressed up as a finding.

04

Hide an assumption

Every parameter in the model is listed in the appendix with its source: measured from your data, stated by you, or an industry default. Defaults are flagged and counted. Where a parameter could bias the headline figure, we choose the value that makes it smaller.

05

Show you someone else's logo

We are early. This page carries no client names, no testimonials and no press marks, because we will not manufacture proof we have not earned. The method is published in full — judge that instead.

Two customer service representatives with headsets working at laptops in a dispatch office.
Every figure in the report is traced back to a call that arrived here
Common questions

What owners ask before they send data.

What does a DialWorth diagnostic cost?

The diagnostic starts at $3,000 as a fixed fee and takes two to three weeks. Fees are 50% on signature and 50% on delivery. Implementation and monitoring engagements are priced separately and are never a condition of the diagnostic.

What data do you need from us?

Five exports: call detail records from your phone system, bookings and completed job values from your field-service software, a CSR roster, a shift schedule, and two figures from you — contribution margin and what you pay whoever recruits and coaches CSRs. We send an export checklist written for your specific systems.

What happens if our data is not good enough?

Seven data quality gates run before anything is computed. If one fails you receive a readiness report instead of a figure, telling you exactly what to start capturing. There is no charge for that answer and no partial result is published.

Is this call coaching or CSR training?

No. DialWorth is measurement. The output is a quantified figure for forgone booked revenue with a ranked list of remediations. We do not sell scripts, coaching or training programmes.

How is this different from the reports in our phone system?

Phone systems report averages over a month. Forgone capacity does not occur on average, it occurs in half-hour intervals where offered load exceeds staffing, and a monthly average conceals exactly those intervals. DialWorth works at interval resolution and fits caller patience from your own abandonment data.

Which companies is this for?

Home-service companies between roughly $2M and $15M in revenue running three to ten customer service reps on inbound calls — HVAC, plumbing, electrical, restoration, pest and adjacent trades. We work California, Oregon, Washington and Nevada only.

How long does the engagement take?

Two to three weeks from receiving usable data. Most of that is analysis rather than your time; the data pull typically takes about an hour of someone's day.

Will you give us a single number?

No. Every headline figure ships as a range with a most-likely value, because a point estimate implies a precision the underlying data does not support. You also receive a sensitivity analysis showing which assumptions drive the spread.

Next step

A data review, before any fee.

Send us what your phone system and field-service software can export. We run the quality gates and tell you whether your data can support a defensible figure, and what it would take if it cannot. There is no charge for that answer.

Prefer arithmetic first? The estimator gives you a rough range in about sixty seconds from numbers you already know.

We reply with an export checklist for your specific phone system and CRM. No deck.